An exclusive from SherloQ™, powered by IBM Watson
Using the SherloQ™ AI website core, the lead data used for this analysis came from dealerships in New England and was anonymized. The first lead that was assessed came in as an organic call on February 12, 2020 and the final lead that was assessed came in as an organic email received on March 27, 2020. A total of 546 leads came in during this timeframe.
The sources of these leads are both paid and organic, coming in as calls, chats or emails, and with 92% of the leads being organic and 8% being paid. There were no paid emails. Half of the leads came in by chats, about a third (34%) were emails and the remaining 16% were calls.


Looking at the contact type, regardless of source, chats made up 50% of the contacts, emails a third, and calls the remaining 16%.

The leads came in under categories that are listed in the table below.
Fifty-six percent of all the incoming leads came from the “Purchasing Car” category. No other category made up more than 10%, although “Used” was 10% of the leads. To simplify, grouping the smaller categories into groups seems logical for further analysis. Therefore, 10 named categories were grouped into two groups: “Buy/Trade-In” and “Service/Parts.”

Almost three-quarters of the leads fell under “Buy/Trade-In,” not quite 20% were “Service/Parts,” and the other 9% was unspecified.

Focusing on the 73% of leads that are under the “Buy/Trade-In” category, more specific categories are quantified, as seen in Table 2 and in the graph below.

The “Purchasing Car” category is the most frequent with 77% and the “Lease” category was 5% of this group’s leads.
The “Service/Parts” category, which made up 18% of all the leads, contained more specific categories: service, parts, oil change and recall. Almost half of this group’s leads were in the “Service” category, with another quarter under “Oil Change.” “Parts” made up 18% of these leads, with “Recall” at almost 10%.

Category by Contact
Looking at the category groups compared to the source of leads shows some interesting trends. It must be noted that calls have a higher rate of unknowns than emails or chats.


The distribution of category group within contact type is similar between organic and paid leads, even with the large discrepancy in the number of leads. This is illustrated in the chart below. Calls were more evenly divided between the three category groups. Organic emails were almost completely “Buy/Trade-In.” Chats were about 70% “Buy/Trade-In” and approximately 25% “Service/Parts.”
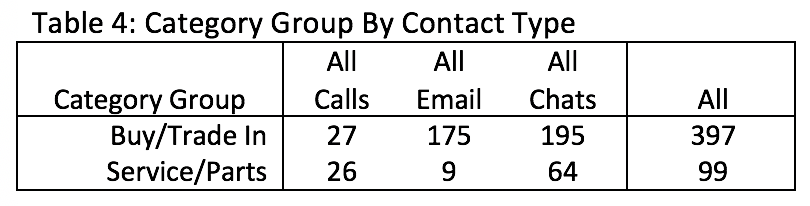
Considering the contact type based on the category groups, “Buy/Trade-In” leads infrequently resulted in a call. Chats are the most common contact type, but emails were comparable. For “Service/Parts,” chats were also the most frequent contact type, but calls were more common than email, which makes sense since it is more immediate in nature.

Looking at the more specific categories, the most commonly used contact method was email, aside from the “Service” and “Oil Change” categories which usually resulted in a chat, and “Parts” leads which were more likely to call versus email or chat.

Other Findings
First Time Contact
First time contact can only be measured in calls and emails. Of those that measurement is available (274), 77% of the leads were first-time contacts. The rate of first-time contacts differs between source and contact. Ninety-one percent of paid calls were first-time callers, while only 68% of the organic calls were first-time callers. Email had a first-time contact rate of 80%.

*Source:
SherloQ™, powered by IBM Watson
Powering the World’s First AI-Driven Websites & Ad Campaigns